September 15, 2026
The latest edition of the U.S. ESCO Industry Report by Lawrence Berkeley National Laboratory (LBNL) finds that the U.S. energy service company (ESCO) industry continues to show strong growth. The report draws from ESCO industry reported revenue data for the 2022-2024 period, detailing the current size and characteristics of the U.S. ESCO industry. This analysis, which has been updated periodically over the past 20 years, explores significant revenue trends across market segments, geographic regions, ESCO size, financing structure, and business activity. New analysis in this report outlines customer priorities and non-energy benefit drivers of energy savings performance contract (ESPC) projects, adjusted revenue analysis detailing the impacts of inflation on industry growth, and project challenges by market segment.
This report is intended for the ESCO industry, policymakers, federal, state, and local government officials and other ESPC customers, researchers, and energy professionals.
LBNL finds that the ESCO industry continues to show strong growth over time. ESCOs reported aggregated industry revenue of $10.7B for 2024 and projected industry annual revenue of $15.0B in 2027. Revenue grew 103% since 2014 and 78% since 2018. However, after adjusting for inflation, revenue growth was less significant at 56% (since 2014) and 45% (since 2018).
ESCO Industry Revenue Over Time (Nominal and Adjusted*)
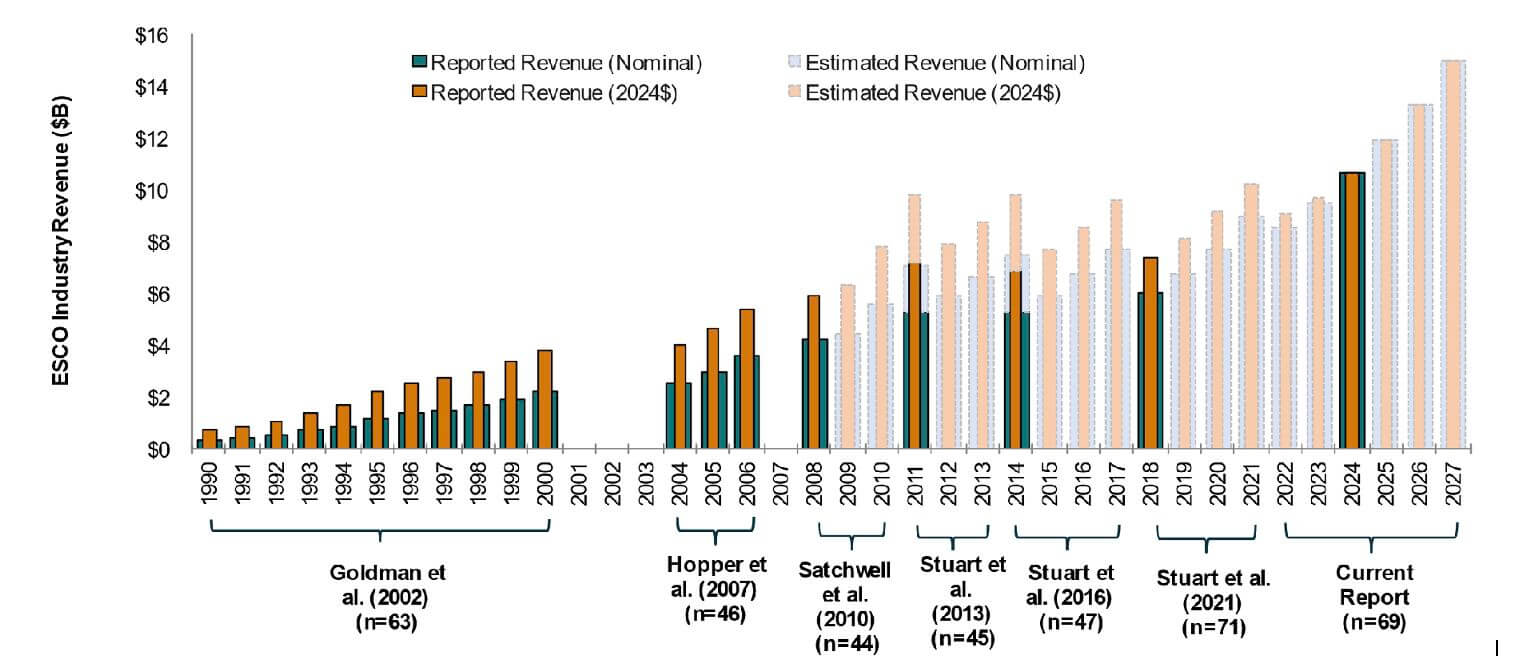
*Revenue adjusted to 2024$ using GDP deflator. All revenue displayed in the report is in US dollars ($). Throughout the report, the term “n= XX” will be used to denote the sample size based on the number of ESCO responses to a particular survey or survey question. Source: United States Bureau of Economic Analysis.
A regional analysis of revenue reveals that the largest share of ESCO revenue occurred in the Pacific census sub-region ($1.54B), while the smallest share of revenue was in the West North Central census sub-region ($498M). These findings change when adjusting for population density on a per capita basis, which helps make sub-regions comparable. The Mid-Atlantic and New England sub-regions led in terms of largest share of revenue on a per capita basis.
ESCO Industry Revenue per Capita* by U.S. Census Sub-Region (2024)
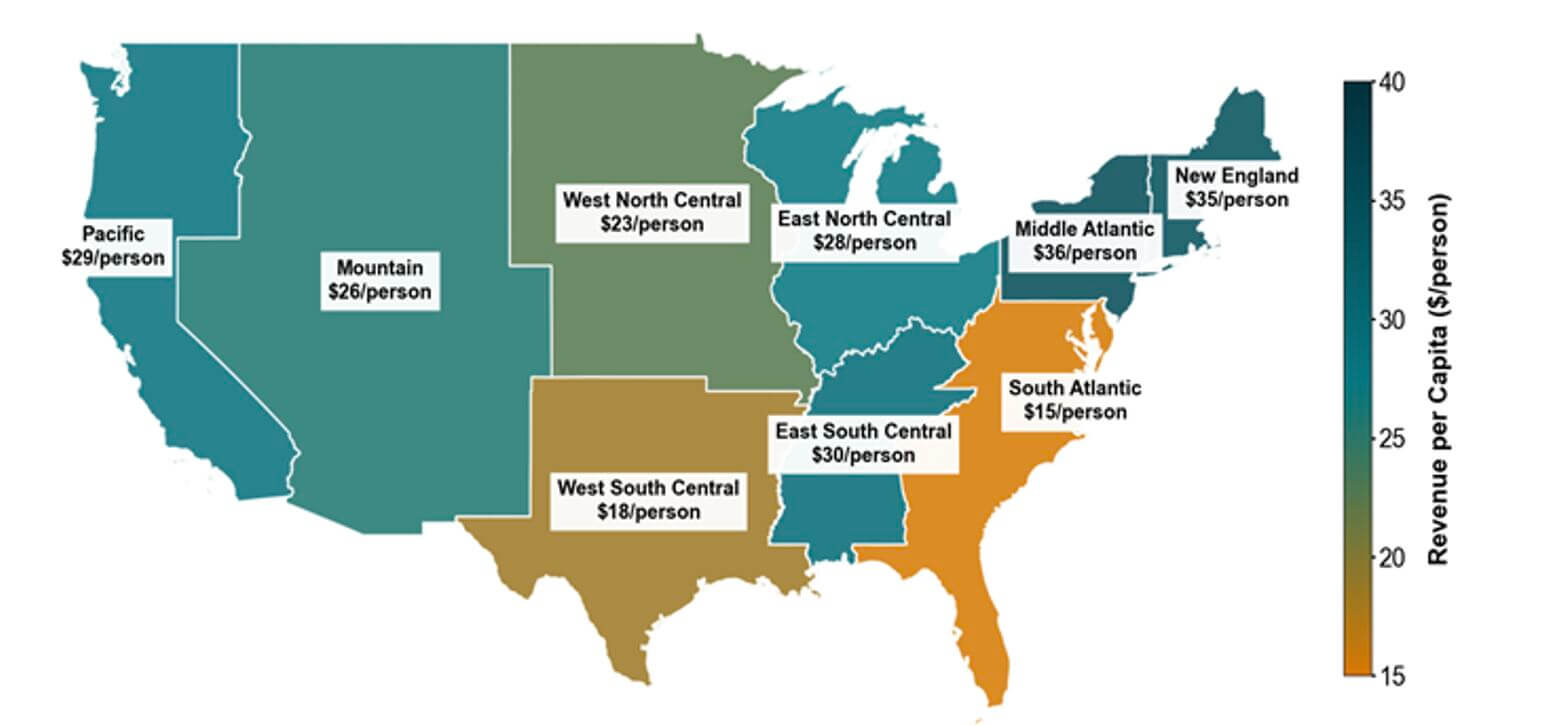
*2024 Revenue per capita displayed based on 2024 U.S. Census Bureau population estimates ($/person, nominal)
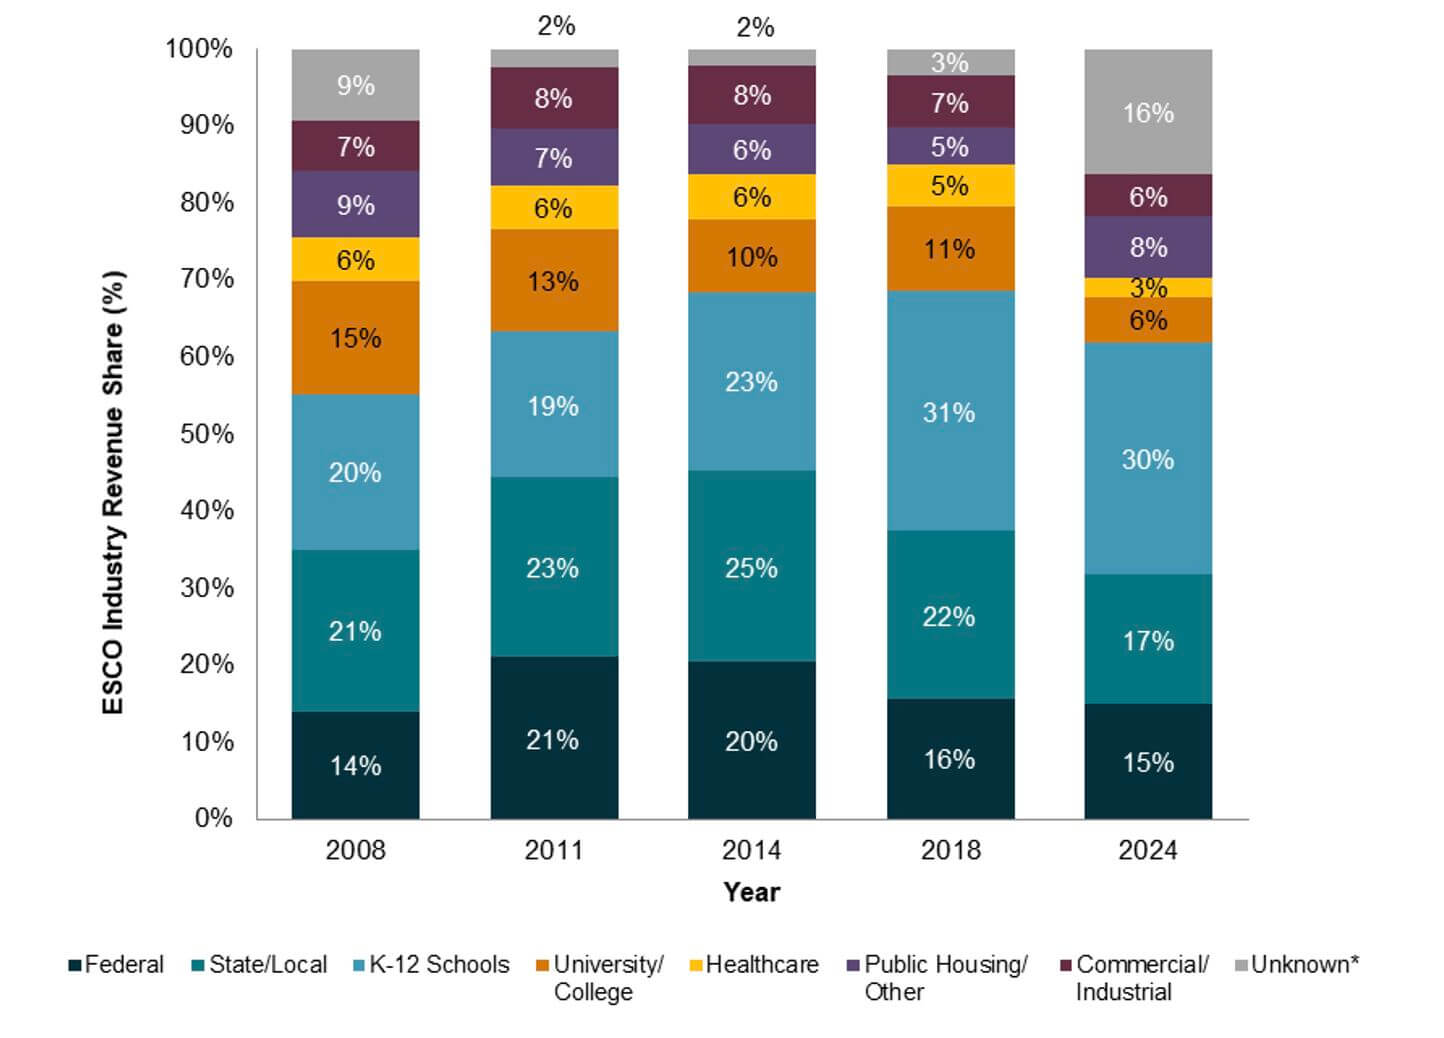
An analysis of total ESCO revenue by market share found that the largest shares of revenue over the last 10 years were generated in the state/local (17-25%) and K-12 schools (23-30%) market segments. Overall, public and institutional customers, including federal government, municipal government, university, K-12 schools, and hospitals (“MUSH” market), as well as public housing customers, continued to make up the majority of ESCO industry revenue in 2024 (78%).
ESCO Industry Revenue by Market Share Over Time (2008-2024)
The authors will host a webinar highlighting key findings from the report on October 15th at 12:00 PT/3:00 PM ET. Register to attend the webinar here:
https://lbnl.zoom.us/webinar/register/WN_IRKJXa2fQlWPPAv-nXau3Q
Download U.S. ESCO Industry Report: Industry Size and Recent Market Trends, 2022-2024 here. The report’s authors are Kathryn Chelminski, Johnny Wong, and Dana Robson.
The U.S. Department of Energy’s Office of Critical Minerals and Energy Innovation (CMEI) supported this work through the Federal Energy Management Program (FEMP) and the Office of State and Community Energy Programs (SCEP).
For More Information
Contact:
Kathryn Chelminski, KChelminski@lbl.gov
Dana Robson, drobson@lbl.gov